Explore Analytics
Explore provides you the tools for deep data analysis.
- Get an in-depth understanding of your audience with our data visualization platform.
- Assess the potential of exploration analytics with our new Business Intelligence tool.
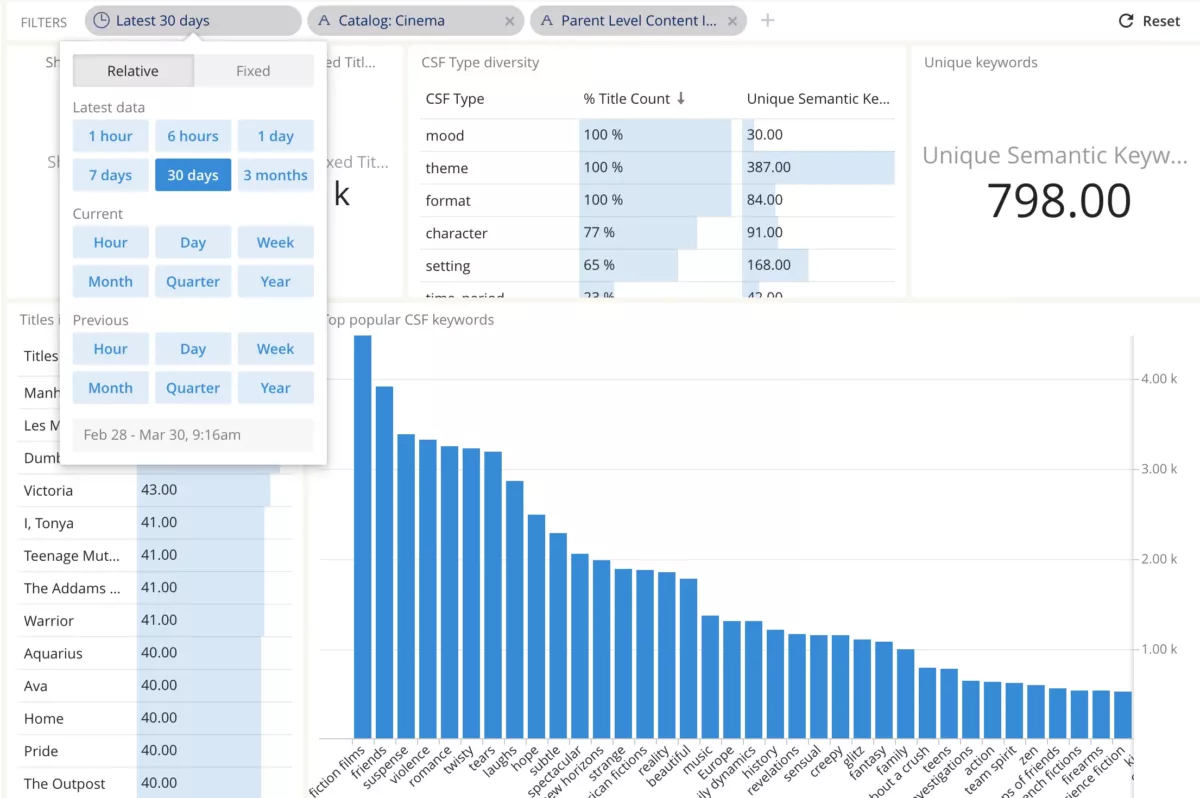
Get insights in less than 3 clicks
Enjoy a user friendly interface and dynamic interactions.
- Everything is clickable and interactive.
- Quickly master monitoring content performance and user behaviour.
- Easily grasp all data.
Go beyond numbers
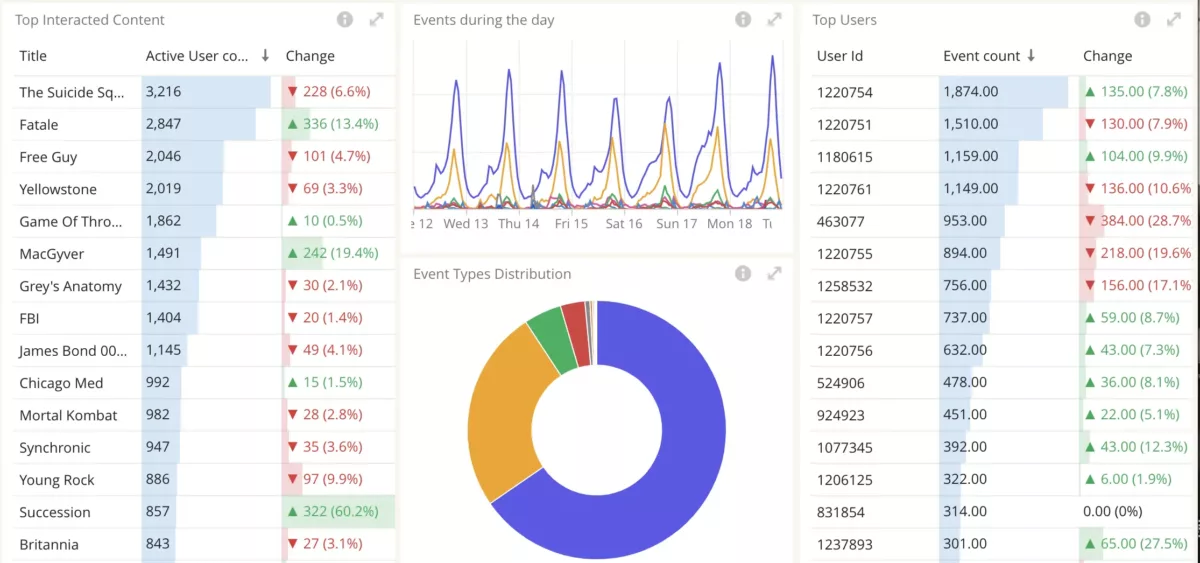
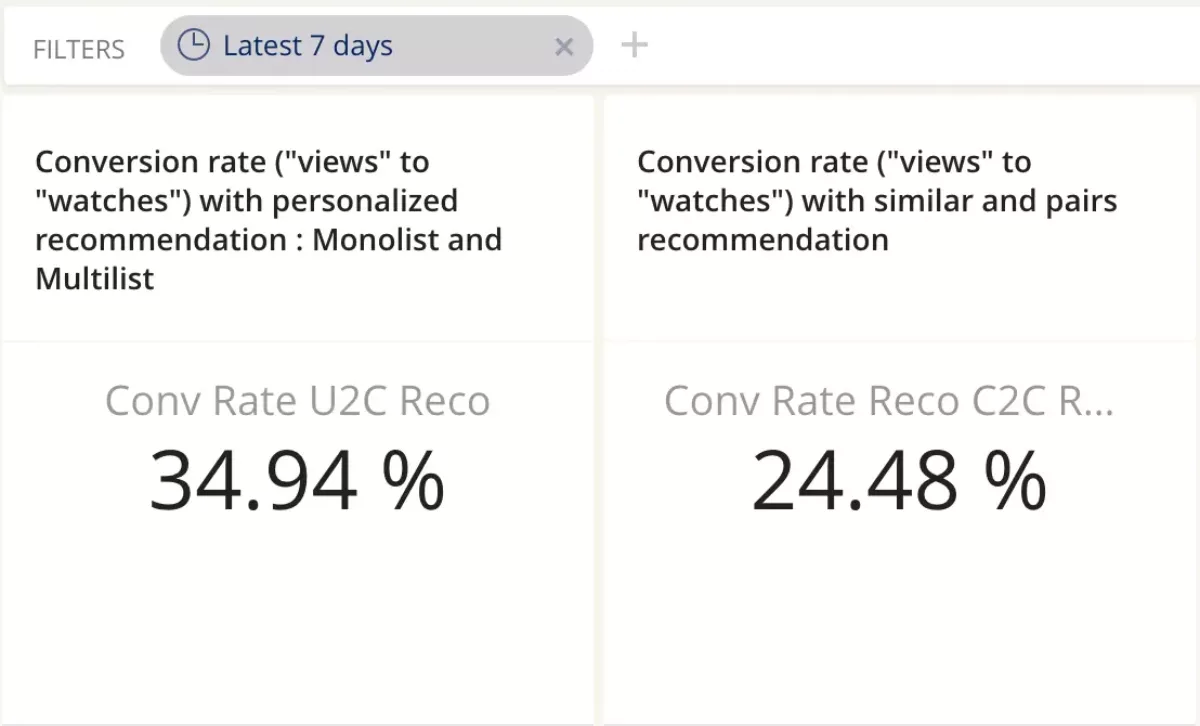
Explore encompasses 30+ metrics and charts, including Key Performance Indicators (KPIs). Get instant visualization of indicators such as:
- conversion rates
- recommendation coverage
- top recommended content
- and much more

Use case – Top trending
Created in collaboration with Sky Switzerland and using data from Spideo Explore, Top trending is a Discover feature showing the current most popular items in a given catalog.
- Data visualisation becomes a discovery feature.
- Analytics are converted into a concrete User Experience and Retention plan.
- Temporal trends are used to show popular contents in real time.

Designed for your teams
Explore can be used by Marketing, Business Intelligence, and Editorial teams.
- Monitor with Explore and make informed decisions.
- Discover personas and clusters of users.
- Identify churn and program target actions.

Empower Recommendation Expertise
Access data from other Spideo products while using Explore, for an efficient and time-saving experience.
Through Explore, monitor the Spideo recommender system performance and use the pieces of information as next-level knowledge.
Explore all of our product
Inspirations
Customer stories

04 Apr. 2022
SKY Switzerland
SVOD and OTT services experience the risk of churn due to seasonality while broadcasting new seasons of popular shows. How can accurate and relevant recommendations help them in delivering the right content at the right time in order to avoid churn in such a context? How can they keep their users engaged with personalized recommendations?

01 Jul. 2019
Televisa
Launching an international OTT strategy. Televisa launches Blim in order to retain subscribers with exclusive Spanish speaking content on its own On-Demand platform.


Content Personalization
Recommendation engines for streaming platforms – Discovery based on Trust, Transparency, and Controllability – Real time Personalization