Release notes 2025
This page contains release notes that apply to all APIs on the Base platform for the 2025 versions.
2025r11
All APIs available when business API module is active
Previously, when the business API module was activated, the required APIs needed to be set in the Available Business APIs field in the WOnComponent drop-down list before they could be used.
From this version, all business APIs are automatically available when the module is active. Therefore, the Available Business APIs field has been removed.
When configuring the business API interface service, the business API browser will allow users to search for and add all existing APIs.
Fix for performance due to logging
Previously, the business API interface service had some performance issues related to logging. Even when the Logging check box was not selected, the service still calculated the logs, which was inefficient when many calls were sent. This issue has been fixed in this version. The logs are only calculated when the check box is selected, meaning performance should improve.
2025r8
Simplified REST exchange log maintenance
In previous versions, there were two ways to clear REST exchange log entries:
-
A maintenance task, which deleted the oldest records first, could only be scheduled at specific times and used a configurable chunk size (though this parameter was not user-editable).
-
A separate service, which deleted records in an unpredictable order, always used a hardcoded chunk size of 1000, and could run at configurable intervals.
This duplication created unnecessary complexity without providing real benefits, since both methods ultimately removed the same number of records.
From this version, the standalone service has been removed, and now the REST exchange log cleanup is handled exclusively through the maintenance task, ensuring a simpler and more predictable process.
2025r6
Detect unresponsive REST workers in REST services
Previously, when running a REST service as a Windows service, it was possible that the Mediagenix Base platform process did not respond anymore, but that the Windows service was still running. This was visible in the service monitor by a warning icon.
In version 2024r4, the multithreaded REST services were introduced. Since that version, REST workers could crash or stall, but the service heartbeat was still updated because the service itself was still working.
From this version, additional checking is done on the REST workers. If a REST worker has not properly handled a REST call in the last period defined by the Heartbeat time-out property on the service configuration, the REST service will go in a so-called cardiac arrest. This will also be visible in the service monitor by the warning icon.
Because of this, a REST service can go into cardiac arrest in the following cases:
-
One of its REST workers has crashed or stalled and is not doing anything anymore.
-
One of its REST workers is spending a lot of time handling a REST call.
In the second case, nothing is technically wrong, because in the end, the REST worker will finish its work, so after a while, the service will no longer be in cardiac arrest. If the REST workers typically handle long calls, it is the responsibility of the customer to make the Heartbeat time-out large enough to avoid false warnings.
Because of this change, the Heartbeat time-out property is now mandatory on the service configuration when creating or editing a service. During the upgrade, the default value of 15 minutes will be entered on every existing REST service.
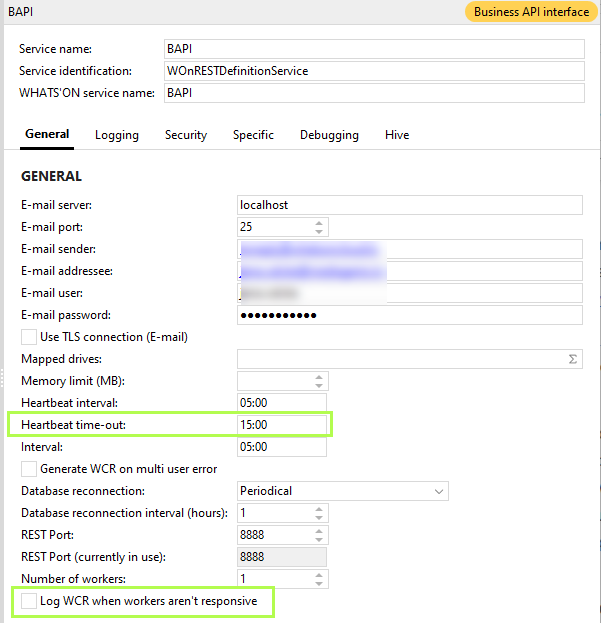
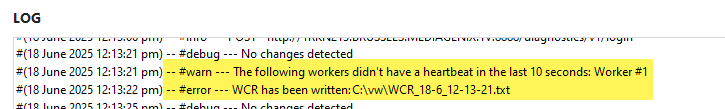
Moreover, the Log WCR when workers aren’t responsive checkbox has been added to the service configuration of REST services. When this checkbox is selected, a crash report will be created when at least 1 REST worker is not responsive. When a crash report is created, it will have the following cause: Cause of Dump: The following workers didn't have a heartbeat in the last 900 seconds: Worker #1, Worker #2. The service log will also indicate this and the fact that a crash report was written. By default, the check box is cleared for all services after the upgrade.
Fix for format of time fields in REST calls
Previously, when doing REST calls and a time field was part of the response, the format defined in the time formats was not used. This was because the general options were not initialised at the right moment. This issue has been fixed in this version.
2025r5
TLS certificates on services in security health check
In the previous version, the security health check application was added, which aims to check if certain security standards are met. It contained a task to check the role enabling password for Oracle databases.
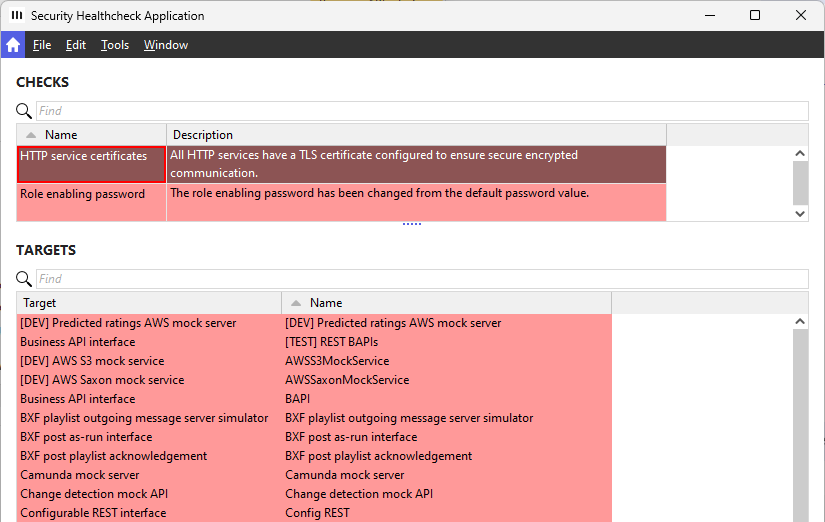
From this version, an additional task has been added to the health check: HTTP service certificates.
This task checks if all integration services, such as REST, SOAP etc, have a certificate selected in the TLS certificate property on the Security tab of the service configuration.
If not, the item in the CHECKS list will have a red background. When it is selected, the TARGETS list contains the services that are checked. The list shows the service identification in the Target column and the service name in the Name column.
To solve the issue, the Open insecure service settings command in the Tools menu can be used, which opens the service configuration navigator for all services without a certificate.
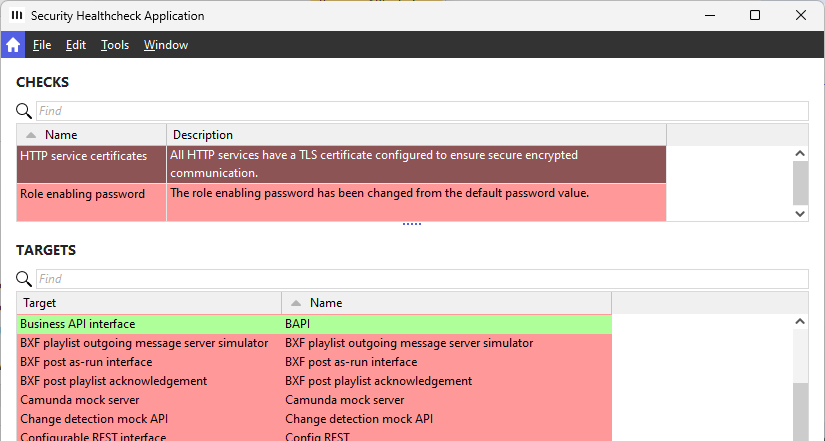
When a certificate is set and the user refreshes, the target for the service turns green. When all services have been corrected, the task itself will also become green.
Switch service monitoring on or off for all services
The service monitor navigator shows the status of services and also a certain amount of its latest logs if the Enable service monitor logging check box is selected on the service.
To calculate which logs should be shown, services create database entries to check how many logs there are and if any logs should be deleted to limit to the maximum amount. For example, if 50 logs should be shown and there are 51 logs, the oldest are deleted.
However, if multiple services are running, this process of counting and deleting can cause a lot of database traffic. Previously, when the database was running on PostgreSQL, this could cause performance issues or disrupt monitoring.
From this version, the service monitor functionality has been reworked to be more efficient.
The Enable service monitor logging by default check box on the Database tab of the site preferences has been replaced by the Switch off all service monitoring logging check box in the system default layout.
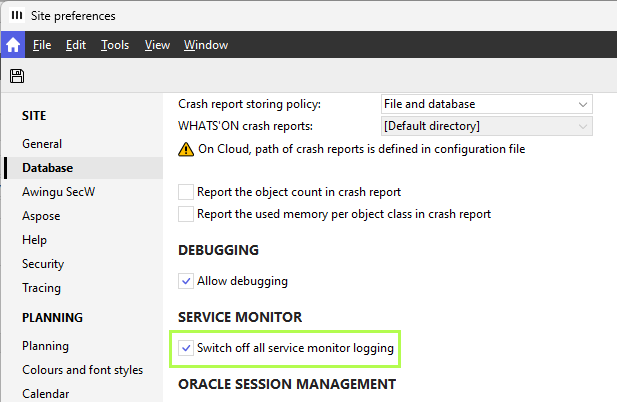
The check box overrides the service monitor properties on each service configuration.
When the checkbox is selected, none of the services will generate service monitor records that are shown in the service monitor. On the service configuration, the service monitor properties are made read-only. Additionally, the Enable service monitor logging check box will be cleared.
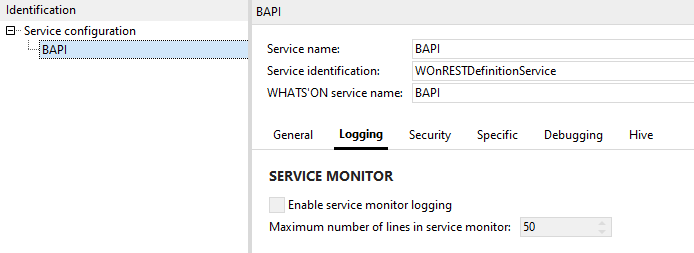
When the Switch off all service monitor logging check box in the site preferences is cleared, then each service will generate service monitor records according to its own configuration. On the service configuration, the service monitor properties are enabled with their previous values and can be configured.
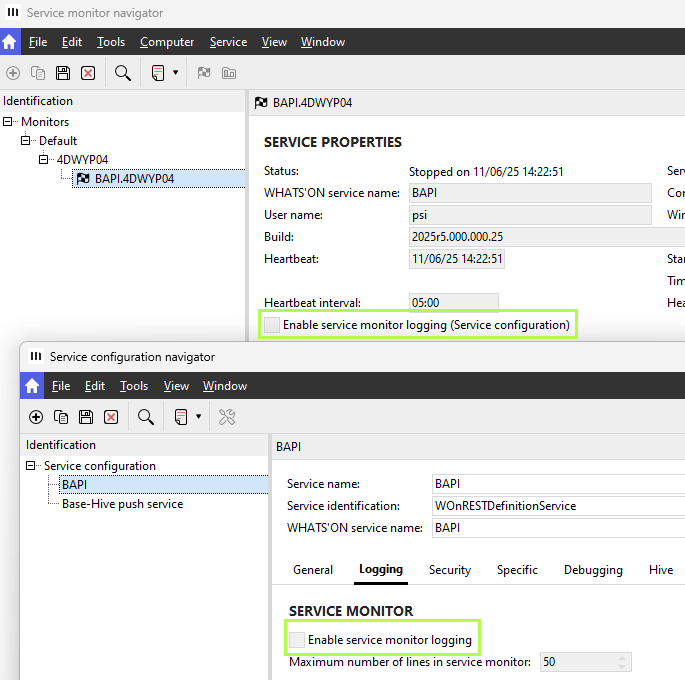
The Enable service monitor logging (Service configuration) property can also be configured for each service in the service monitor navigator. It is affected by the Switch off all service monitor logging check box in the same way as those on the services, since they are connected.
When the Cloud module is active, the Switch off all service monitor logging check box in the site preferences will be automatically selected after the upgrade. This means there will be no service monitor logging. If the module is not active, the check box is cleared and service monitoring will still be enabled.
Because of the rework, all existing monitoring logs will be removed.
2025r4
Secure email communication without username and password
On service configurations and certain viewers on report definitions, it is possible to configure email settings. These include an email user, email password and the Use TLS connection check box.
Previously, it was not possible to use a secure connection without having the email user and password defined. In this case, the email would not be sent. (RN-2074)
From this version, a secure connection can be used without requiring authentication. This means the Use TLS connection check box can be selected while the email user and password are left empty to send secure emails.
Fixed issues
-
From this version, passwords and/or tokens are always obfuscated in REST exchange log entries, even if an unknown content type or a wrong content type is used in the calls.
-
Previously, in REST APIs, searches with percent-encoded characters in the URL, such as %25 representing %, had double encoding, leading to failures. For example, the title Next 10% could only be found if it was included as Next%2010%2525 instead of Next%2010%25. This issue has been fixed in this version.
-
Previously, when the publication API was not listed in the Available Business APIs on the WOnComponent drop-down list, it could still be added to the business API interface service. This issue has been fixed in this version.
2025r3
Fix for empty collections
Previously, sending POST or PUT calls using any of the BAPIs would crash if a collection array was empty, such as broadcastWindows in the POST /trailers call of the trailer API, and no corresponding message existed to signal that it could not be removed. This issue has been fixed in this version. The APIs can now handle empty collection arrays.
2025r1
Performance tracing on business API and open API
When the business API or open API services execute REST calls, they are logged in a REST exchange log entry. This log entry shows how long it took to receive a response.
To have more information on what is done during these calls, the performance tracing can also be enabled on the Business API interface service and Configurable REST interface service.
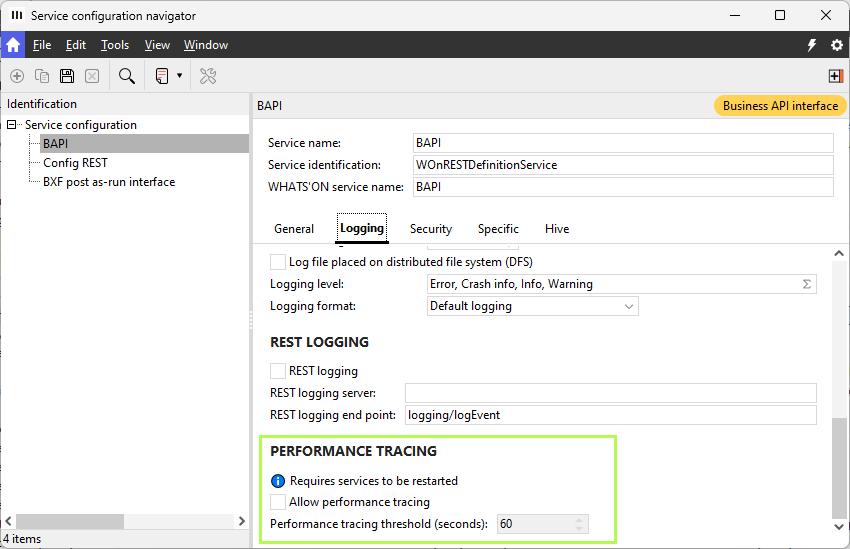
In the Logging tab, the PERFORMANCE TRACING group box has been added with the following properties:
-
A note to inform users that the service has to be restarted after selecting the check box below.
-
Allow performance tracing: Select to enable performance tracing for the service. When this is done, the Performance tracing threshold is enabled.
-
Performance tracing threshold (seconds): Type or choose the threshold for the performance tracing, which is set to 60 seconds by default. The minimum value is 0, which can be used to trace calls that only take milliseconds. Performance tracing applies only to calls that exceed the defined threshold.
Note that the Logging check box in the tab also has to be selected or the performance is not traced either.
See the performance tracing browser and navigator for more info on the performance logs.