Release notes 2025
This page contains release notes that apply to all APIs on the Base platform for the 2025 versions.
2025r5
TLS certificates on services in security health check
In the previous version, the security health check application was added, which aims to check if certain security standards are met. It contained a task to check the role enabling password for Oracle databases.
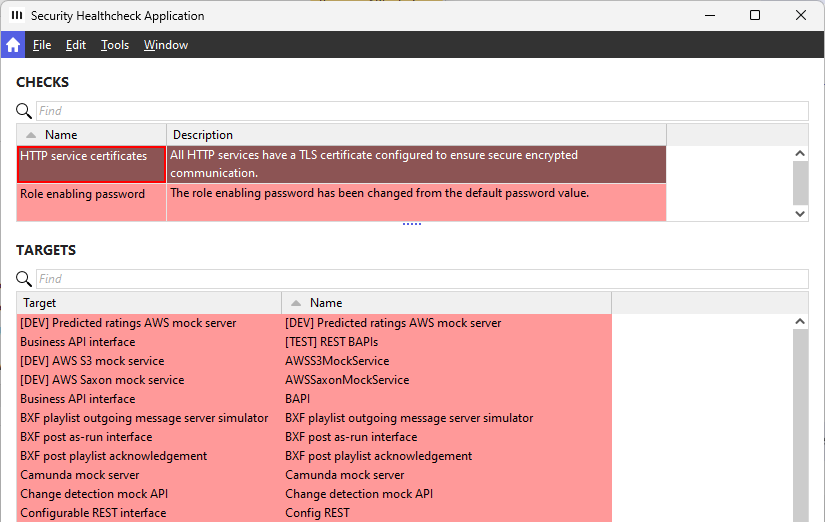
From this version, an additional task has been added to the health check: HTTP service certificates.
This task checks if all integration services, such as REST, SOAP etc, have a certificate selected in the TLS certificate property on the Security tab of the service configuration.
If not, the item in the CHECKS list will have a red background. When it is selected, the TARGETS list contains the services that are checked. The list shows the service identification in the Target column and the service name in the Name column.
To solve the issue, the Open insecure service settings command in the Tools menu can be used, which opens the service configuration navigator for all services without a certificate.
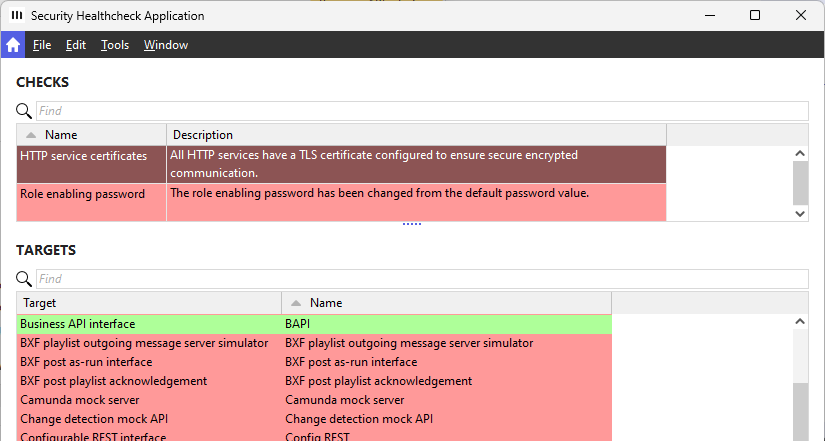
When a certificate is set and the user refreshes, the target for the service turns green. When all services have been corrected, the task itself will also become green.
Switch service monitoring on or off for all services
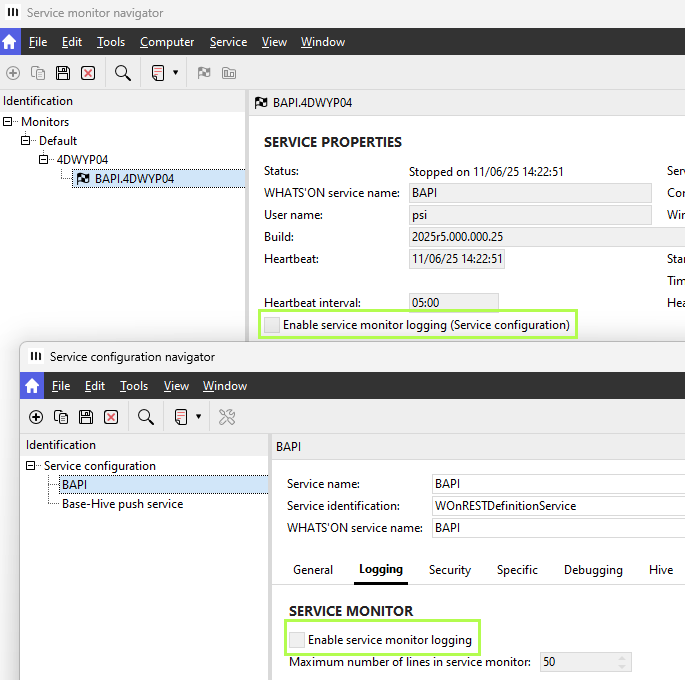
The service monitor navigator shows the status of services and also a certain amount of its latest logs if the Enable service monitor logging check box is selected on the service.
To calculate which logs should be shown, services create database entries to check how many logs there are and if any logs should be deleted to limit to the maximum amount. For example, if 50 logs should be shown and there are 51 logs, the oldest are deleted.
However, if multiple services are running, this process of counting and deleting can cause a lot of database traffic. Previously, when the database was running on PostgreSQL, this could cause performance issues or disrupt monitoring.
From this version, the service monitor functionality has been reworked to be more efficient.
The Enable service monitor logging by default check box on the Database tab of the site preferences has been replaced by the Switch off all service monitoring logging check box in the system default layout.
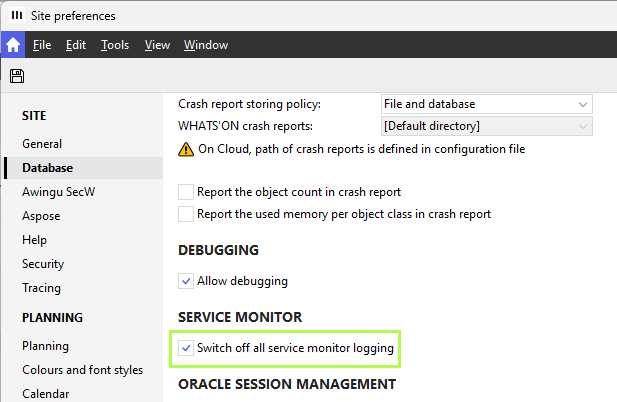
The check box overrides the service monitor properties on each service configuration.
When the checkbox is selected, none of the services will generate service monitor records that are shown in the service monitor. On the service configuration, the service monitor properties are made read-only. Additionally, the Enable service monitor logging check box will be cleared.
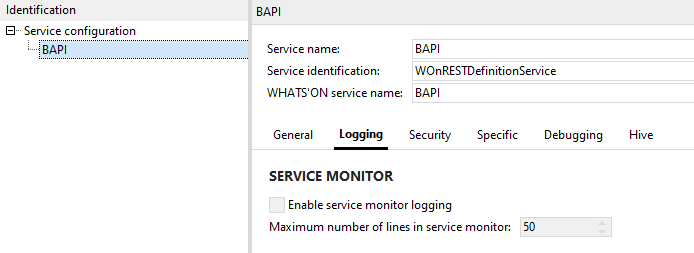
When the Switch off all service monitor logging check box in the site preferences is cleared, then each service will generate service monitor records according to its own configuration. On the service configuration, the service monitor properties are enabled with their previous values and can be configured.
The Enable service monitor logging (Service configuration) property can also be configured for each service in the service monitor navigator. It is affected by the Switch off all service monitor logging check box in the same way as those on the services, since they are connected.
When the Cloud module is active, the Switch off all service monitor logging check box in the site preferences will be automatically selected after the upgrade. This means there will be no service monitor logging. If the module is not active, the check box is cleared and service monitoring will still be enabled.
Because of the rework, all existing monitoring logs will be removed.
2025r4
Secure email communication without username and password
On service configurations and certain viewers on report definitions, it is possible to configure email settings. These include an email user, email password and the Use TLS connection check box.
Previously, it was not possible to use a secure connection without having the email user and password defined. In this case, the email would not be sent. (RN-2074)
From this version, a secure connection can be used without requiring authentication. This means the Use TLS connection check box can be selected while the email user and password are left empty to send secure emails.
Fixed issues
-
From this version, passwords and/or tokens are always obfuscated in REST exchange log entries, even if an unknown content type or a wrong content type is used in the calls.
-
Previously, in REST APIs, searches with percent-encoded characters in the URL, such as %25 representing %, had double encoding, leading to failures. For example, the title Next 10% could only be found if it was included as Next%2010%2525 instead of Next%2010%25. This issue has been fixed in this version.
-
Previously, when the publication API was not listed in the Available Business APIs on the WOnComponent drop-down list, it could still be added to the business API interface service. This issue has been fixed in this version.
2025r3
Fix for empty collections
Previously, sending POST or PUT calls using any of the BAPIs would crash if a collection array was empty, such as broadcastWindows in the POST /trailers call of the trailer API, and no corresponding message existed to signal that it could not be removed. This issue has been fixed in this version. The APIs can now handle empty collection arrays.
2025r1
Performance tracing on business API and open API
When the business API or open API services execute REST calls, they are logged in a REST exchange log entry. This log entry shows how long it took to receive a response.
To have more information on what is done during these calls, the performance tracing can also be enabled on the Business API interface service and Configurable REST interface service.
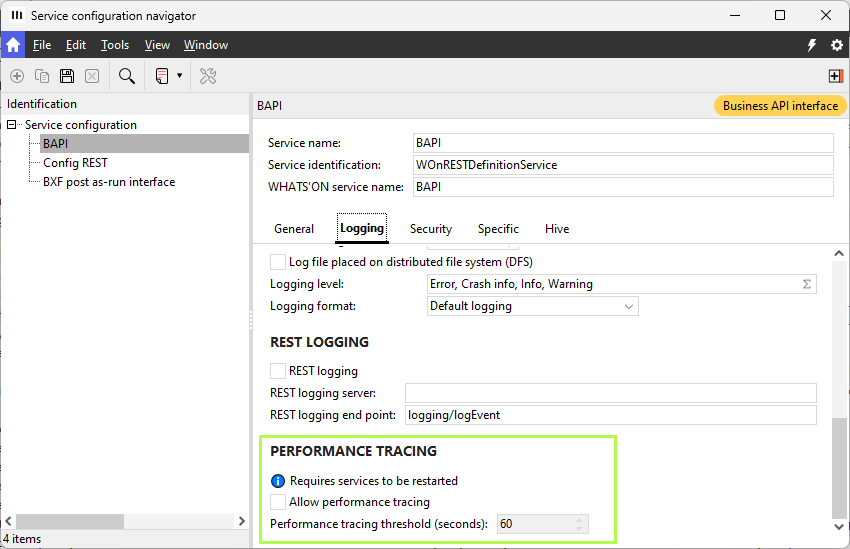
In the Logging tab, the PERFORMANCE TRACING group box has been added with the following properties:
-
A note to inform users that the service has to be restarted after selecting the check box below.
-
Allow performance tracing: Select to enable performance tracing for the service. When this is done, the Performance tracing threshold is enabled.
-
Performance tracing threshold (seconds): Type or choose the threshold for the performance tracing, which is set to 60 seconds by default. The minimum value is 0, which can be used to trace calls that only take milliseconds. Performance tracing applies only to calls that exceed the defined threshold.
Note that the Logging check box in the tab also has to be selected or the performance is not traced either.
See the performance tracing browser and navigator for more info on the performance logs.